End-to-End Product • 2020
MEC Runcharts
Improving the shop floor.
Role(s) Performed
Project Lead • UX Designer • UX Researcher • UX Engineer • Scrum Master • Producer • Project Manager • Graphic Designer • Information Architect • Product Manager
Tools Used
Adobe XD • Figma • Miro • Trello • Adobe Creative Cloud • Google Forms • Google Meet • Analog Materials
Methodologies
Surveying & Screening • Qualitative Interviews • Mixed Method Data Compilation • Geurilla Recruitment • Moderated User Testing • Object-Oriented UX Design • Guerilla Product Research • Storymapping • Personas & User Design • Personas & User Design • Prototype User Testing • Brand Creation • Project Manager


Understanding the project.
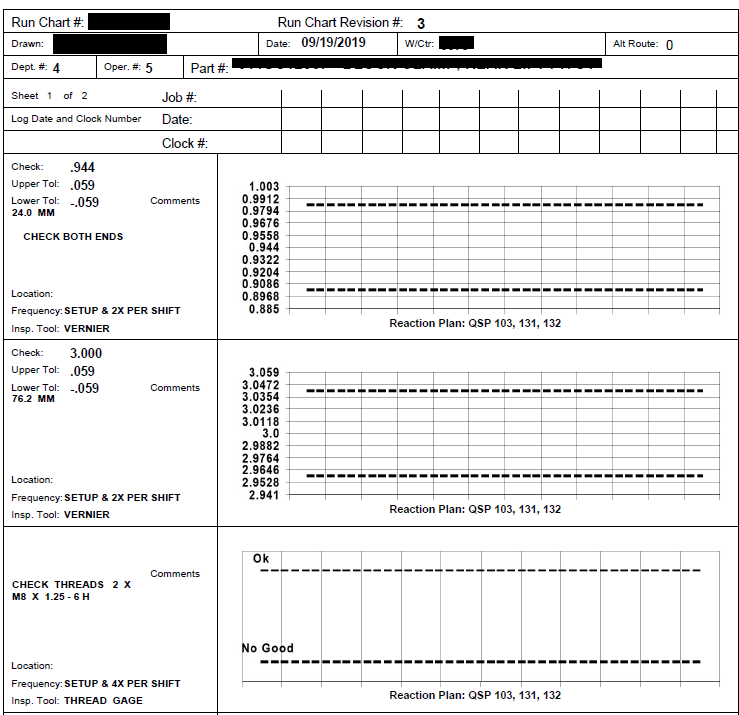
Runcharts are a common method of tracking work on the shop floor, providing engineers and machinists with a shared language and consistent data entry. However, paper charts can be frustrating, involving constant printing and shredding. Updating paperwork can take days, leading to mismatches between paper and digital records, which causes improper counting and submission issues. The designer worked on this project from start to finish, developing a process from research to final delivery.

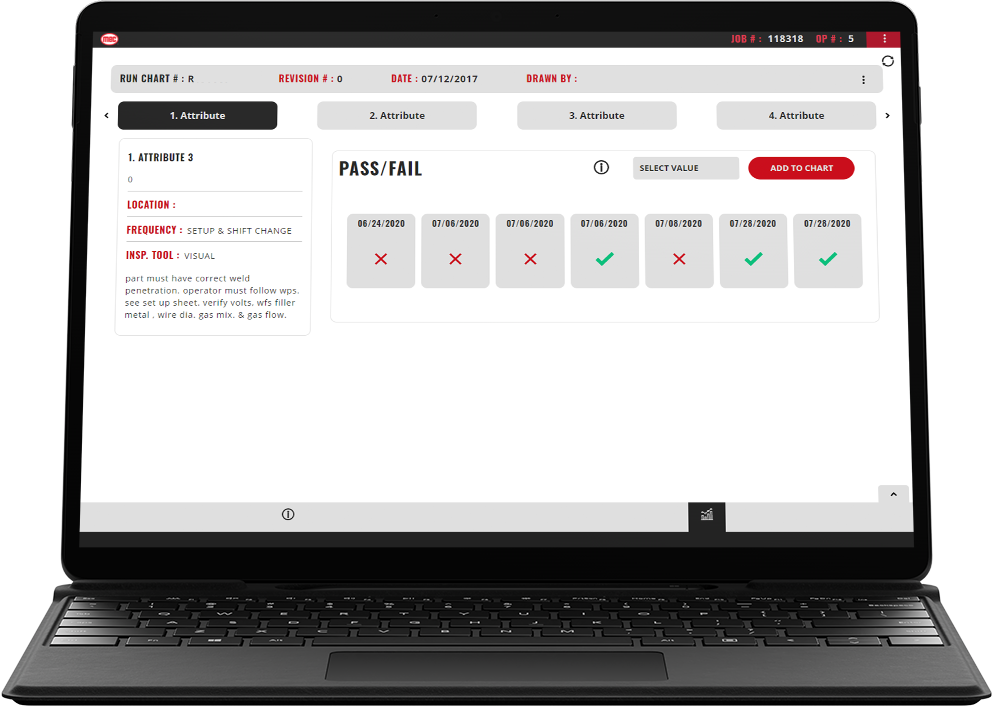
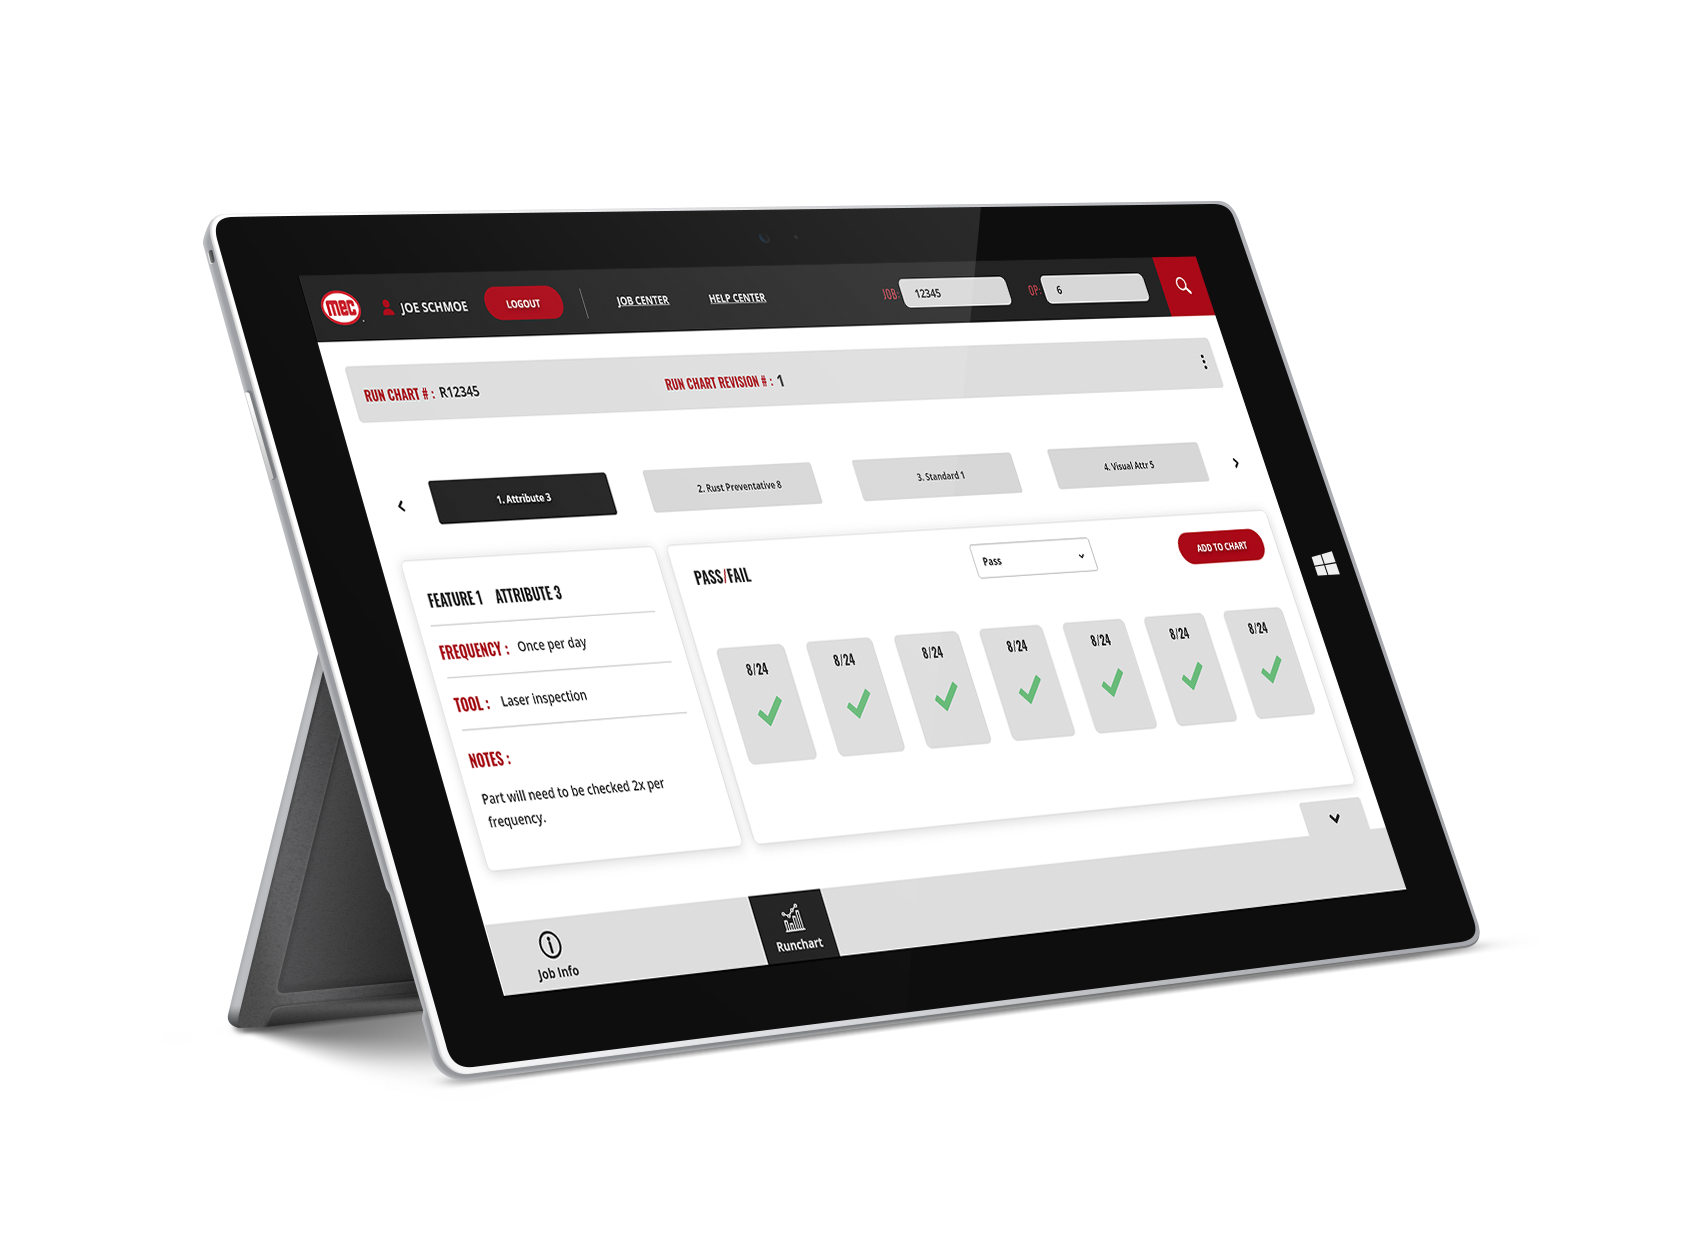
The final product.

The original runchart.
Production & Budgeting.
All tasks were performed in-house, so budget was determined by level of effort on the developers, users, and time needed for final production and release to take place.
Technology and hardware was determined by bulk quantity cost, Microsoft Surface tablets were selected because they are lightweight and easy to troubleshoot. $10,000 dollars was originally allocated for product purchase at the original location where the app was to be released.
Conception & Planning.
The designer started by reviewing notes provided by superiors and incorporating insights from personal research. They began visualizing a digital version of the paper runchart, which consists of several rows of checks. To ensure success, the application needed to present information effectively without merely replicating the paper format. Instead of scrolling, they opted for a horizontal swiping method, as it suited each record and was compatible with the touch-screen tablets being used. Wireframes were created to depict horizontal swiping and tapping gestures, with the number of checks per chart averaged out for better usability.
User Research & Testing.
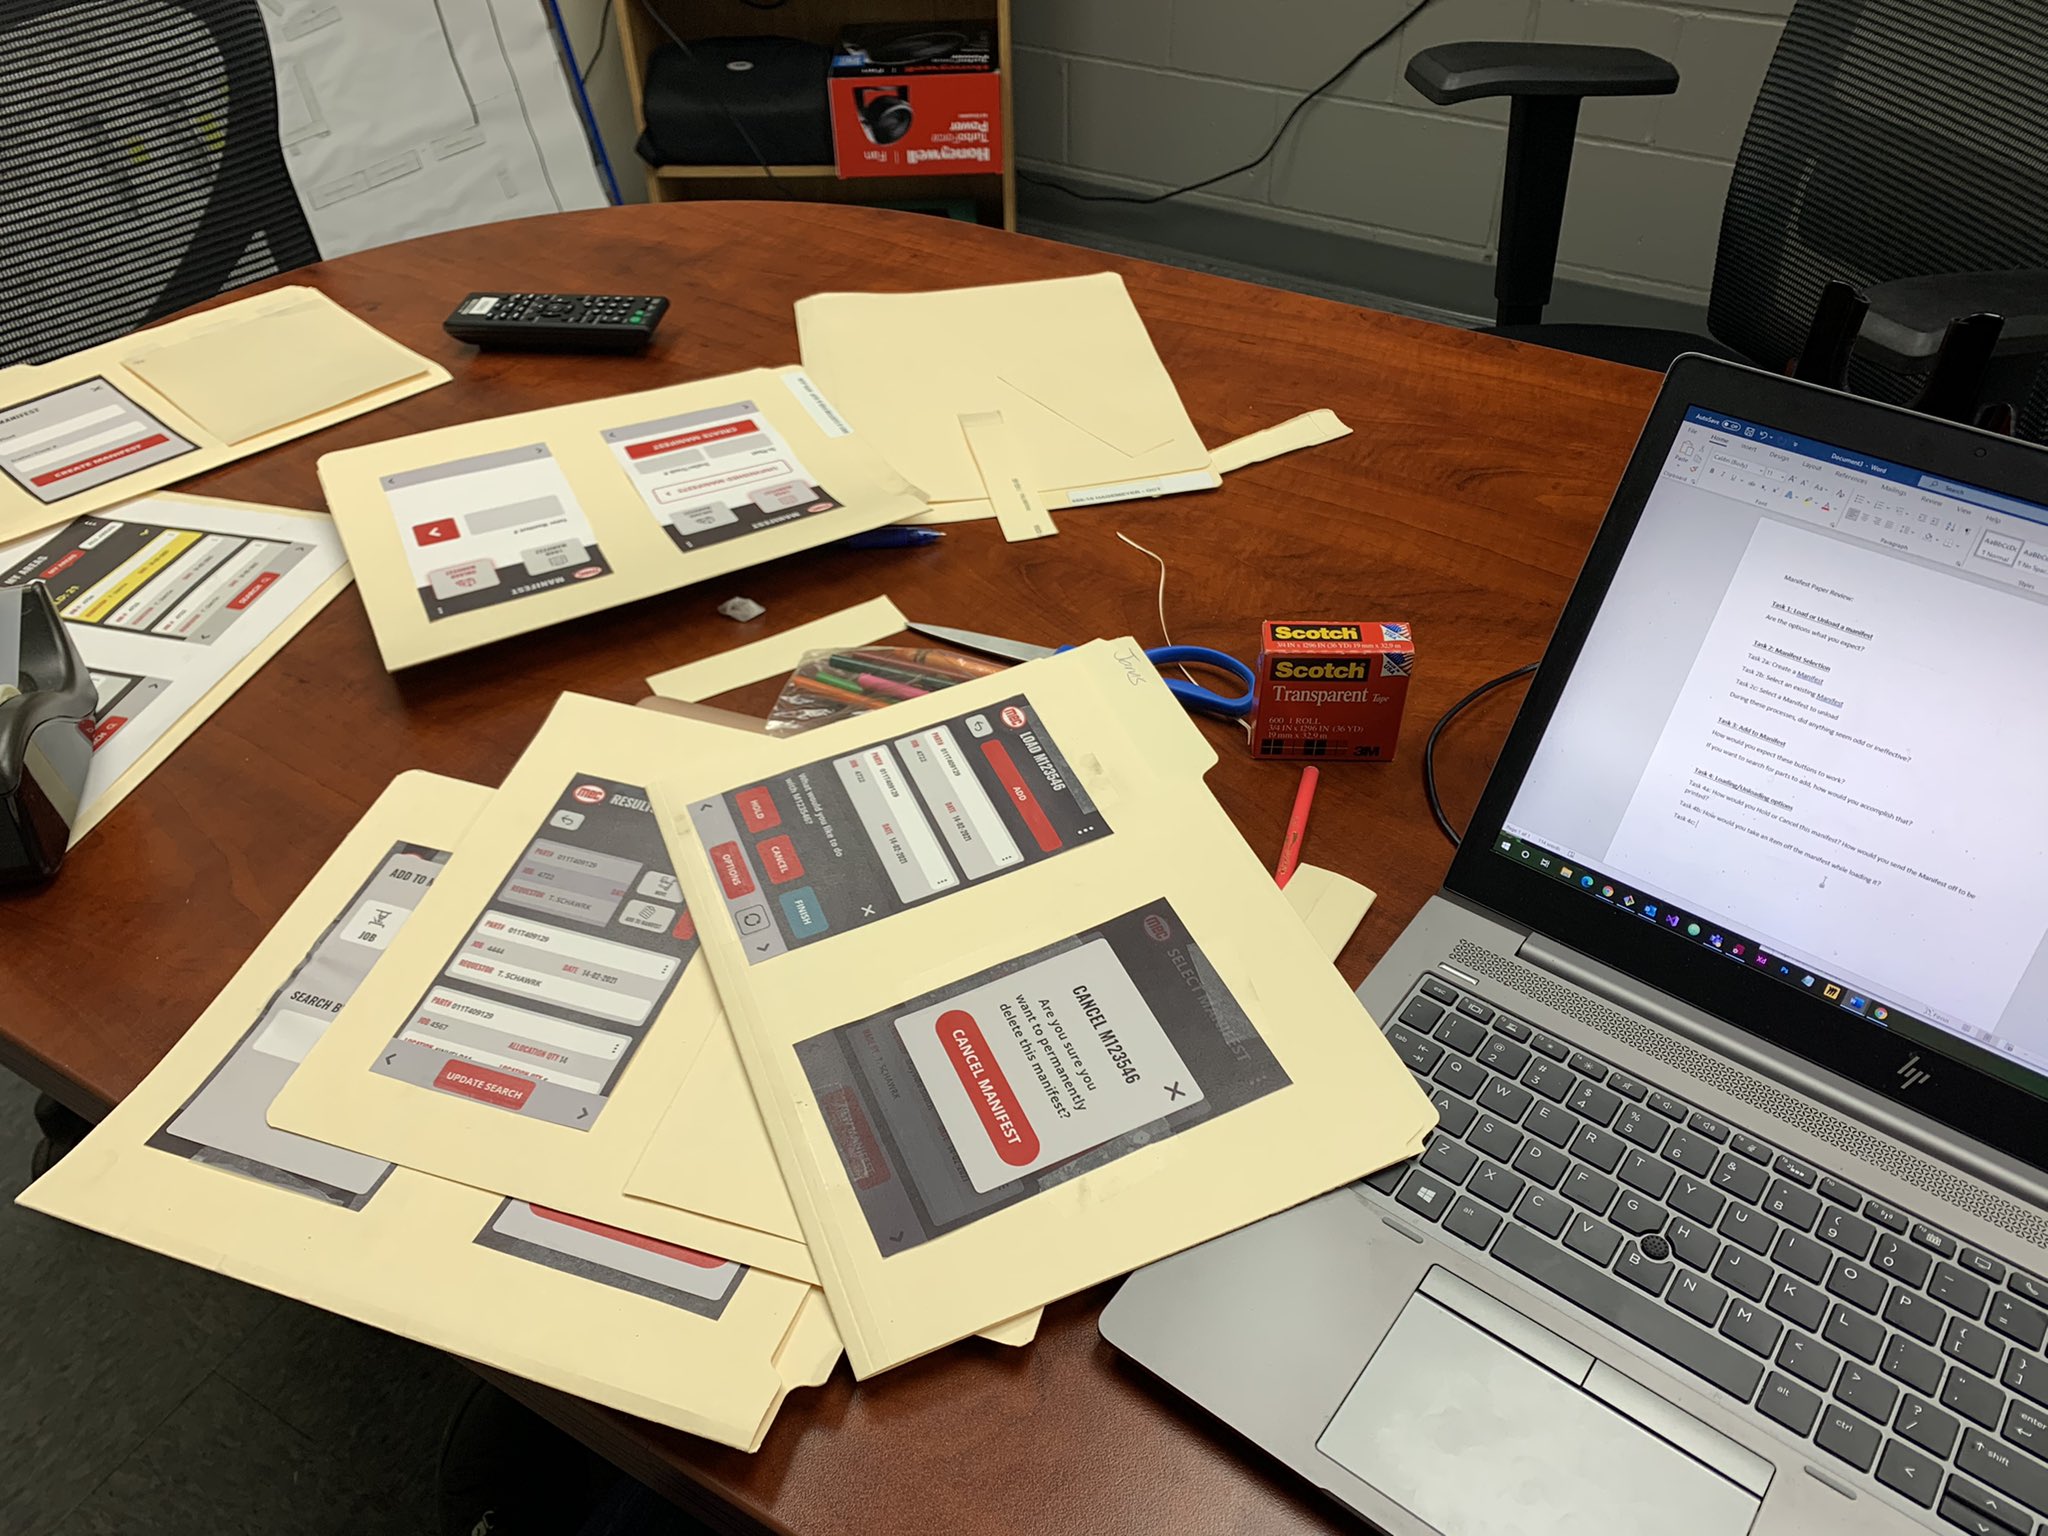
Users were involved in the process at every step. The designer believes in approaching challenges from the users' perspective, considering them the best experts to consult. Wireframes, wireflows, and prototypes were created using both Adobe XD and traditional paper methods, a process the designer playfully refers to as "UX Arts n' Crafts."
The designer would map out scenarios and consult users, often having them mark paper prototypes with sticky notes or pens. For digital prototypes, users were asked to perform specific tasks while their behavior was recorded. After each development phase, the solutions were tested with the users through practical testing sessions.
It was a privilege to have such accessible user input and testing opportunities. One particular survey helped demonstrate to various departments that transitioning to a paperless system wouldn’t be as overwhelming for manufacturing employees as initially thought.
Alpha Release.
For the app’s first release, the designer assigned four users to test it over the course of a couple of months. During the project's planning phase, a schedule of time requirements was set for each phase, with beta testing included as part of that timeline. The designer followed up with users weekly during the beta testing period, gathering their notes and recommendations. These insights were then used to create improvement tickets for the final release of the app.
Runchart Official Live Release.
Version 1.0 of the app was successfully released in 2020 across two plants selected for tech upgrades. The app was warmly received by users, who expressed excitement about the prospect of receiving more tablets to replace paperwork and gain easier access to the company intranet at their workstations.
Next Steps.
Version 2.0 will incorporate several updates based on feedback from users of Version 1.0, along with new features being developed in the designer’s workspace, affectionately referred to as the "Creativity Dome."
In addition, data will be collected and compiled on how much money and waste the app is saving over year 1. This savings will be funneled back into the project budget for additional updates and testing.


